 Saidul Badhon10 min read
Localhost Lies: How We Made the Jutsu Console Twice as Fast
We cut the time it takes the Jutsu console's pages to become usable by 48% without adding a server or rewriting anything. Almost all of it came from deleting work nobody had asked for. Here's what we found, and the checklist I'd run on any web app.
- Performance
- React
- ClickHouse
- Jutsu
Until last week, opening the dashboard in the Jutsu console downloaded the whole product first. The compliance module. The super admin panel. A full code editor. Two charting libraries. A map renderer. Every integration dialog we have. You asked for an espresso and we handed you the café.
Full disclosure: I'm the lead engineer at Jutsu, and this is my own team's work, so weigh it accordingly. We went through every page of the console and every API call it makes, looking for requests that were wasted, duplicated, too big or badly timed. We fixed the ones that were safe to fix and measured everything before and after.
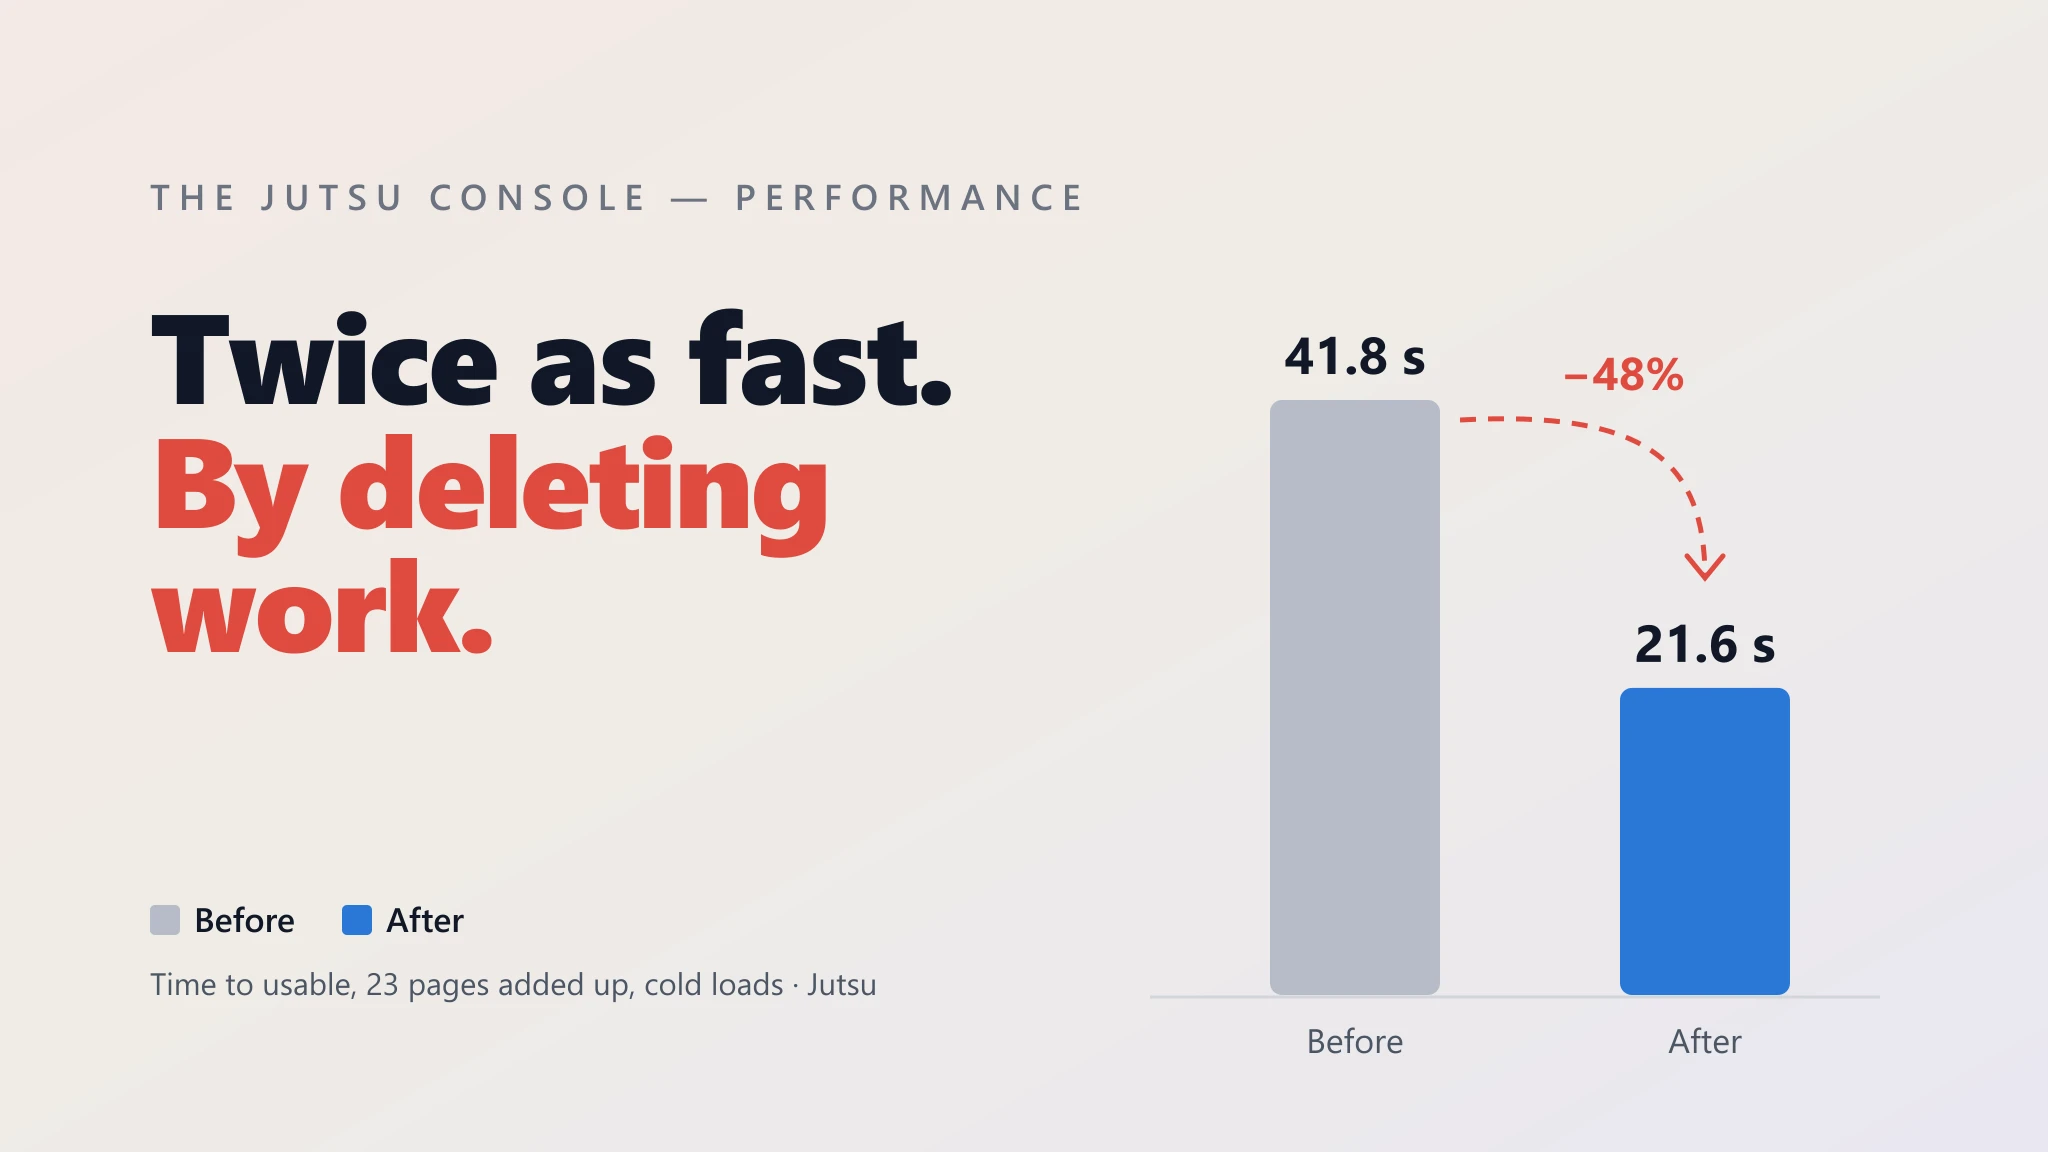
The result: the 23 pages we test are, added up, 48% faster to become usable on a cold load, they download 73% less JavaScript, and ClickHouse spends 73% less time answering them. We added no servers and rewrote nothing.
None of it was clever. Nearly all of it was deleting work nobody had asked for. That's the part I think is worth writing about, because I'd bet your app has the same problems.
The Jutsu console, before and after
- Time to usable, 23 pages added up
- 41.8 s → 21.6 s
- 48% less, on cold loads over a throttled connection
- JavaScript downloaded
- 39.6 MB → 10.7 MB
- 73% less, because pages now load when you open them
- Main-thread blocking
- 7.67 s → 1.99 s
- 74% less time where the browser can't respond to you
- Time spent in ClickHouse
- 5.55 s → 1.51 s
- 73% less, from 40% fewer queries that read far less
Sums across 23 console pages, each loaded cold, median of 3 runs. No new servers, no new infrastructure, no rewrite. Source: Jutsu.
Localhost lies
The first thing I'd tell anyone doing this: don't measure on localhost. A request to your own machine costs nothing, so waste is invisible. Fifteen extra round trips feel exactly like zero.
So we measured something closer to what a customer actually gets:
- A production build, served gzipped the way our CDN serves it.
- Edge, driven by Playwright, with the network throttled to 40 ms of latency and 20 Mbit/s.
- A cold cache on every load, and the median of three runs.
The data came from a throwaway benchmark org, created through the same sign-up path a customer uses, with its own databases and the roughly 145 detection rules every new org gets. We seeded it at six sizes, from 100 events up to 5 million events with 250,000 alerts. No customer data was involved, and we deleted the org afterwards.
One honest caveat: this ran on a developer laptop, and timings moved by up to 25% between runs. Request counts, bytes and query counts are exact. Read the timings for direction and size, not to the millisecond.
Fewer requests was never the point
This is the chart that surprised me most:
The number of requests barely moved. Everything heavy did.
How much each measure fell, added up across 23 console pages. We sent 9% fewer API requests, but the JavaScript, the main-thread work and the ClickHouse time each fell by almost three quarters.
Main-thread blocking
JavaScript transferred
ClickHouse time
First contentful paint
Time to usable
ClickHouse queries
API requests
Postgres queries
Source: Jutsu. Production build served gzipped, Edge under Playwright, throttled to 40 ms latency and 20 Mbit/s, cold cache, median of 3 runs. API requests include CORS preflights.
Show the data
| Measure | Before | After | Change |
|---|---|---|---|
| Main-thread blocking | 7.67 s | 1.99 s | −74% |
| JavaScript transferred | 39.64 MB | 10.72 MB | −73% |
| ClickHouse time | 5.55 s | 1.51 s | −73% |
| First contentful paint | 36.26 s | 14.22 s | −61% |
| Time to usable | 41.83 s | 21.59 s | −48% |
| ClickHouse queries | 77 | 46 | −40% |
| API requests | 570 | 518 | −9% |
| Postgres queries | 619 | 562 | −9% |
We only sent 9% fewer API requests. If you'd judged the work by the network tab's request count, you'd have called it a failure. But the requests we kept are cheaper, the JavaScript is a quarter of the size, and the database reads far less. Speed came from the size of the work, not the number of things on the waterfall.
Every one of the 23 pages got faster, most by between a third and two thirds:
Every page got faster. Most by a third to two thirds.
Time until each page is usable: its first burst of API calls has finished. Cold load, with 10,000 events and 1,000 alerts in the org. Connections is the one that barely moved, because it still carries every connect dialog we have.
- Before
- After
Action Center
Dashboard
Events
Organization
Alerts
Alert detail
Compliance
Incidents
Compliance controls
Account
Rules marketplace
Compliance policies
Rules
Incident detail
Notifications
Organization team
Risks
People
Connections
Reports
Organization audit
Incident handoff
Copilot
Source: Jutsu. Production build served gzipped, Edge under Playwright, throttled to 40 ms latency and 20 Mbit/s, cold cache, median of 3 runs. The before times are worked back from the published after times and percentage changes.
Show the data
| Page | Before | After | Change |
|---|---|---|---|
| Action Center | 2.56 s | 956 ms | −62.6% |
| Dashboard | 2.36 s | 790 ms | −66.5% |
| Events | 2.32 s | 934 ms | −59.8% |
| Organization | 2.21 s | 808 ms | −63.4% |
| Alerts | 2.03 s | 1.28 s | −36.9% |
| Alert detail | 2.02 s | 1.34 s | −33.8% |
| Compliance | 1.96 s | 981 ms | −49.9% |
| Incidents | 1.85 s | 1.15 s | −38% |
| Compliance controls | 1.74 s | 892 ms | −48.8% |
| Account | 1.72 s | 651 ms | −62.2% |
| Rules marketplace | 1.72 s | 745 ms | −56.7% |
| Compliance policies | 1.71 s | 955 ms | −44.1% |
| Rules | 1.70 s | 901 ms | −46.9% |
| Incident detail | 1.66 s | 1.10 s | −33.7% |
| Notifications | 1.65 s | 748 ms | −54.7% |
| Organization team | 1.65 s | 955 ms | −42% |
| Risks | 1.61 s | 971 ms | −39.8% |
| People | 1.61 s | 935 ms | −42% |
| Connections | 1.59 s | 1.47 s | −7.6% |
| Reports | 1.58 s | 939 ms | −40.7% |
| Organization audit | 1.57 s | 737 ms | −53.2% |
| Incident handoff | 1.50 s | 662 ms | −55.9% |
| Copilot | 1.50 s | 700 ms | −53.3% |
Action Center went from 2.56 s to 956 ms. The Dashboard went from 2.36 s to 790 ms. The one that barely moved is Connections, at 8%, because its page still bundles every connect dialog we have. It's next.
So where was the time going? Five places.
1. We were shipping the whole console as one file
The console was a single 6.16 MB script, 1.81 MB gzipped. No route splitting at all. Every page you might ever open was in it, so every page you did open waited for all of them.
What the browser has to download before it can show you anything
Before, every one of the console's pages was in one script, so the dashboard couldn't start until compliance, the super admin panel, a code editor, two charting libraries and a map renderer had downloaded. Now the 94 routed pages are separate chunks, and the start is a fifth of the size.
- Before: the whole console, one script
- After: the entry chunk
Uncompressed
Gzipped, what you download
Source: Jutsu. Production build served gzipped, Edge under Playwright, throttled to 40 ms latency and 20 Mbit/s, cold cache, median of 3 runs.
Show the data
| Size | Before | After | Change |
|---|---|---|---|
| Uncompressed | 6.16 MB | 1.28 MB | −79% |
| Gzipped, what you download | 1.81 MB | 376 KB | −79% |
Now all 94 routed pages load on demand, and the entry chunk is 1.28 MB, or 376 KB gzipped. The page you opened loads at start-up, the 13 main sections prefetch in the background once the console is idle (unless your browser asks to save data), and the other 80 load when you open them.
Two details made the difference between "split" and "actually fast":
- Don't let splitting add a waterfall. On its own, code splitting would have made the page wait for the login check before it even started downloading. So the console now fetches the page you're opening at the same time as it checks your session.
- Skip React's placeholder pause. React holds a lazy page's loading placeholder for about 300 ms. For a page that has already downloaded, that's pure delay, so we bypass it and render straight away.
2. Every request knocked twice
Our API never told browsers they could cache the answer to a CORS preflight. So almost every request was really two: an OPTIONS call asking permission, then the actual GET. The dashboard sent 15 preflights for 15 real requests, and paid again on every 15-second poll.
The fix is one header. Access-Control-Max-Age defaults to 5 seconds when you don't send it, which for a 15-second poll means never. We now cache preflights for two hours, which is also the most Chromium browsers will honour (Firefox allows 24 hours). A URL polled at 0, 15 and 30 seconds used to cost six round trips. Now it's four, and then one per poll.
It isn't finished. The first request to each URL still sends a preflight, and a few of our URLs carry a fresh timestamp, so the browser sees a new URL every time and never gets to reuse the answer. That's on the list.
3. The alert list reread two years of history every 15 seconds
This was the big one on the database side. The alerts list, its stats and its filters joined triage, enrichment and verdict data across the tenant's entire history: up to two years of ClickHouse partitions, every 15 seconds. The incident list did the same.
The list only ever shows a time window. So now the lookups are limited to that window. We ran the old and new queries side by side against real ClickHouse and got identical results. The saving grows with history: the more data an org has, the more it used to cost to show them the same screen.
A few smaller database fixes in the same spirit:
- Action Center ranked incidents with one ClickHouse query per open incident, up to 50 of them. A classic N+1. It's now one query, and ClickHouse time per load is 20 to 40 times lower.
- Incident detail no longer scans every alert the tenant owns to find the alerts linked to one incident.
- The policy banner read every member's acknowledgements, up to 50,000 rows, to check whether you had accepted the policy. It now reads your rows.
- Several endpoints made independent reads one after another. They now run in parallel.
4. Requests nobody asked for
This is the category I'd look for first in any app, because it's free:
- Copilot chat history loaded on every page, even with the Copilot panel closed.
- The dashboard fetched the full asset list, with telemetry, just to count it. And the count topped out at 500, so large orgs saw the wrong number anyway. It now asks for a count, and the count is right.
- Incident detail fetched comments, evidence and the team roster for a tab that was disabled.
- The plan card asked for billing details on behalf of users who weren't allowed to see them, got a 403, and showed a red error. On every visit.
- Up to six components fetched the same plan list at the same time.
For that last one, identical requests that are already in flight are now shared. Sharing requests is easy to get subtly wrong, so it has two rules: a read never joins a request that started before a write (or you'd show data from before your own change), and a stuck request never swallows the newer ones queued behind it.
5. Background tabs that wouldn't let go
A security analyst has a lot of tabs open. Ours kept polling every 15 seconds while hidden: Live Events, Connections, Assets, the platform pages and the ingest banner. Nobody was looking at any of them.
They now pause when the tab is hidden and catch up when you come back. The browser has told you this for years through the Page Visibility API; MDN's own example is a dashboard that shouldn't poll the server when nobody can see it. That was literally us.
It holds at 5 million events
A fast console that slows down for your biggest customers isn't fast. So we ran everything at all six dataset sizes:
Bigger orgs don't get slower pages any more
The fastest and slowest time to usable across ten data-heavy pages (Dashboard, Action Center, Events, Alerts, Alert detail, Incidents, Incident detail, Incident handoff, Risks and People), at six dataset sizes from 100 events to 5 million events with 250,000 alerts.
- Before
- After
Before100 to 5M events
After100 to 5M events
Source: Jutsu. Production build served gzipped, Edge under Playwright, throttled to 40 ms latency and 20 Mbit/s, cold cache, median of 3 runs. One exception: at 5 million events, the Dashboard’s event breakdown still takes 1.1 to 1.5 s on a cold cache. We didn’t touch that code in this pass.
Show the data
| Fastest page | Slowest page | |
|---|---|---|
| Before | 1.5 s | 3.6 s |
| After | 0.7 s | 1.4 s |
Before, the data-heavy pages took between 1.5 and 3.6 seconds depending on the page and the dataset. Now they sit between 0.7 and 1.4 seconds at every size, from 100 events to 5 million. The exception is the Dashboard's event breakdown at 5 million events on a cold cache, which still takes 1.1 to 1.5 seconds. We didn't touch that code this time.
Running at scale caught one of my own mistakes, too. The first version of the batched Action Center query used a column alias that quietly switched off the index. Instead of reading 50 incidents' worth of events, it read every event the tenant had: all 5 million. We renamed the alias, added a test for it, and I've adopted a new rule: I don't trust a query I haven't run at scale.
Five real bugs, found by looking
When you go through every request a page makes, you find things that are just broken:
- Reports polled every 5 seconds for as long as a report was running, threw every response away, and never showed the report as finished.
- Notifications: marking one as read cut the list back to 50, undoing every "Load more".
- Alert detail refreshed two to four times every time you came back to the tab.
- The response-policy page could lose your unsaved edits when a background session refresh landed.
- Product tours could start before the page had loaded, and skip steps.
All five turned up because we were reading every request each page made, not because anyone was looking for bugs.
The trade-offs
Some of this has a cost, and I'd rather say so:
- A tab left open across a console update reloads once, the first time you navigate to a page you haven't opened yet.
- New invitations can take up to 2 minutes to reach the notification bell. The notifications page itself is still instant.
- Team member pickers can lag up to 30 seconds behind other people's changes. Your own edits show immediately.
- One real regression: if you click into Alerts within about 2.5 seconds of the console loading, before prefetching starts, it has to download the page first. That click went from 568 ms to 986 ms. After that window, it's as fast as before or faster.
I think those are the right trades for a 48% faster console, but they're trades.
What I'd check in your app
You don't need our stack to find the same things. This is the list I'd run on any web app:
- Measure like a customer. Production build, throttled network, cold cache, a few runs, and a realistic amount of data. Localhost lies.
- Look at your entry bundle. If one script holds every page, split by route, and fetch the page in parallel with your auth check so splitting doesn't add a waterfall.
- Send
Access-Control-Max-Age. Without it, browsers cache preflights for 5 seconds. Then make sure your polled URLs don't change every time. - Bound every query by what the screen shows. A list of the last 24 hours shouldn't join against two years.
- Hunt for N+1s and "fetch everything to count it". Both are easy to miss and easy to fix.
- Don't fetch for things that are closed, disabled or forbidden. A panel nobody opened doesn't need data.
- Share identical in-flight requests, but never across a write.
- Stop polling hidden tabs.
document.hiddenandvisibilitychangehave been there for years. - Run your queries at your biggest customer's scale before you trust them.
The verdict
There was nothing exotic in any of this. No new infrastructure, no clever caching layer, no framework rewrite. We measured honestly, read every request, and removed the work the console was doing that nobody had asked it to do.
What we got for it is a console that's roughly twice as fast, a database doing a fraction of the work, and both of those holding as an org's data grows from a hundred events to five million. Plus five real bugs, fixed on the way.
The fastest request is still the one you never send.
A note on sources: every measurement in this post comes from our full write-up on the Jutsu blog, We Made the Jutsu Console Twice as Fast by Deleting Work Nobody Asked For, published October 4, 2026, which I wrote. The per-page "before" times are worked back from the published "after" times and percentage changes. Browser behaviour for preflight caching and hidden tabs is from MDN's pages on Access-Control-Max-Age, Save-Data and the Page Visibility API. Everything written as "I think" or "I'd" is my opinion.